If you want to suggest changes or enter missing initiatives, you can contact the WP3.1 coordinators and you will receive your login details.
Schematic diagram of the dataflow across an integration initiative
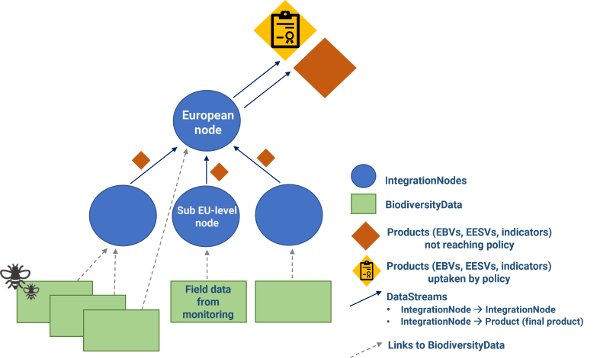
IntegrationNodes
Institutions/projects/platforms integrating/processing biodiversity data to generate Essential Biodiversity Variables (EBVs), Ecosystem Services Variables (EESV's) or any other indicators with potential relevance to environmental policy, particularly at the European level. One single integration initiative can be composed of many nodes operating at different scales (e.g. subnational, national, European-level) in a coordinated manner. One single institution can act as an integration node of different integration initiatives.
Integration node listBiodiversityData
Biodiversity monitoring initiatives responsible for the collection of biodiversity information (data from field observations). The focus of WP3.1 is not to map all monitoring initiatives in Europe, but to ensure that those monitoring initiatives providing data for current biodiversity workflows are well represented in the database.
BiodiversityData listDatastreams arrows
These represent data flows and connect IntegrationNodes across different scales. These contain two types of information: information related to the data flowing between nodes (dataset)
and whether this has been integrated (“products”: EBVs, EESVs, indicators) or not (raw and aggregated data) (dataprocess).
If the data has been integrated/processed, it also contains information about the integration method. A data stream that doesn´t connect with another integration node represents a final Product (EBVs, ESS, Indicator) that can eventually be uptaken by policy or not (this is represented in Figure 1 with diamonds of different colours)